Introduction
The base::trace function is one of my go-tos for debugging (alongside browser, debug/debugonce).
It’s especially useful for debugging code that isn’t under your control, e.g. code in packages that you cannot edit yourself (unless you submit an Open Source pull request).
base::trace allows me to avoid all the overhead of forking a package, creating a temporary version of it and installing it just for debugging purposes.
In this post I’ll share two example situations where base::trace can be useful.
Example 1: Debugging Interactively
Let’s assume we are using a function that provides an unhelpful error message after capturing the original error. Like this one:
my_fun <- function() {
  tryCatch(
    expr = {
      stop("Comprehensive Error message")
    },
    error = function(err) {
      message("Error occurred :)")
    }
  )
}
We would like to see the actual error message, but the code is not under our control!
My favorite way to tackle such issues is with base::trace along with the edit=TRUE argument. It provides a convenient GUI for editing the source code of the function, so I can add a breakpoint or custom debugging code wherever I want.
Now I am able to see the the original error message and understand better what is going on!
Example 2: Debugging Non-Interactively
Sometimes an issue might be occurring only in an environment where we don’t have interactive access, e.g. in CI pipelines or in production.
In those cases we cannot use base::trace with the edit argument. However, we can use the at argument to inject our code programmatically!
We can add the same code line like this:
trace(
  what = my_fun,
  tracer = quote(message(err$message, "\n")),
  at = list(c(2, 3, 3, 2)),
  print = FALSE
)
In the tracer argument we provide our additional expression, while in the at argument we provide in which step that expression should be evaluated.
The
trace.
Ok, but how do we know that at should be set to list(c(2,3, 3,2))?
We can use the body function and convert the result to a list and find which indexes we need to use to get to the line where we want to insert our custom code.
> my_fun_body <- body(my_fun) |> as.list()
> my_fun_body
[[1]]
`{`

[[2]]
tryCatch(expr = {
    stop("Comprehensive Error message")
}, error = function(err) {
    message("Error occurred :)")
})
We can see that our tryCatch expression is at index 2. Let’s dig deeper:
> my_fun_body[[2]] |> as.list()

[[1]]
tryCatch

$expr
{
    stop("Comprehensive Error message")
}

$error
function(err) {
    message("Error occurred :)")
}
We see the error argument of tryCatch can be found at index 3 of my_fun_body[[2]]. Let’s look even deeper:
> my_fun_body[[2]][[3]] |> as.list()
[[1]]
`function`

[[2]]
[[2]]$err


[[3]]
{
    message("Error occurred :)")
}

[[4]]
function(err) {
      message("Error occurred :)")
    }
We want to call our expression right before message("Error occurred"), so again we pick the item at index 3.
> my_fun_body[[2]][[3]][[3]] |> as.list()
[[1]]
`{`

[[2]]
message("Error occurred :)")
We see that message("Error occurred") is at index 2:
> my_fun_body[[2]][[3]][[3]][[2]] |> as.list()
[[1]]
message

[[2]]
[1] "Error occurred :)"
Looks like this is where we want to be! We can now use the series of index to construct the at argument, that’s how we come to at = list(c(2, 3, 3, 2)).
trace(
  what = my_fun,
  tracer = quote(message(err$message, "\n")),
  at = list(c(2, 3, 3, 2)),
  print = FALSE
)
Sometimes, finding the right index can be tricky, so to make sure we inserted the code where we want, we can run trace(my_fun, edit=TRUE) to see how the code changed:
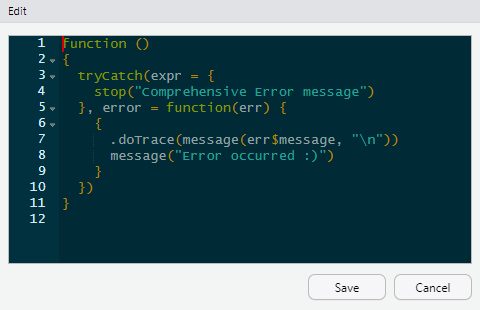
Ok, the .doTrace call is exactly where we want. Now we can push that code to the environment where the issue is happening and learn what the actual error message is.
Conclusions
base::traceis useful for debugging code that is not under our control (e.g. code from external packages we use)- When the issue occurs interactively, we can insert custom code through the GUI provided when we set the
editargument toTRUE - In case the issue occurs in environments where we have non-interactive access, we can use the
atargument to insert code programmatically. Theatargument can be devised based on list indexes of the result of thebodyfunction.